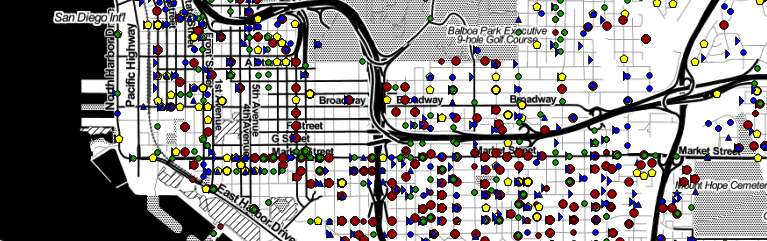
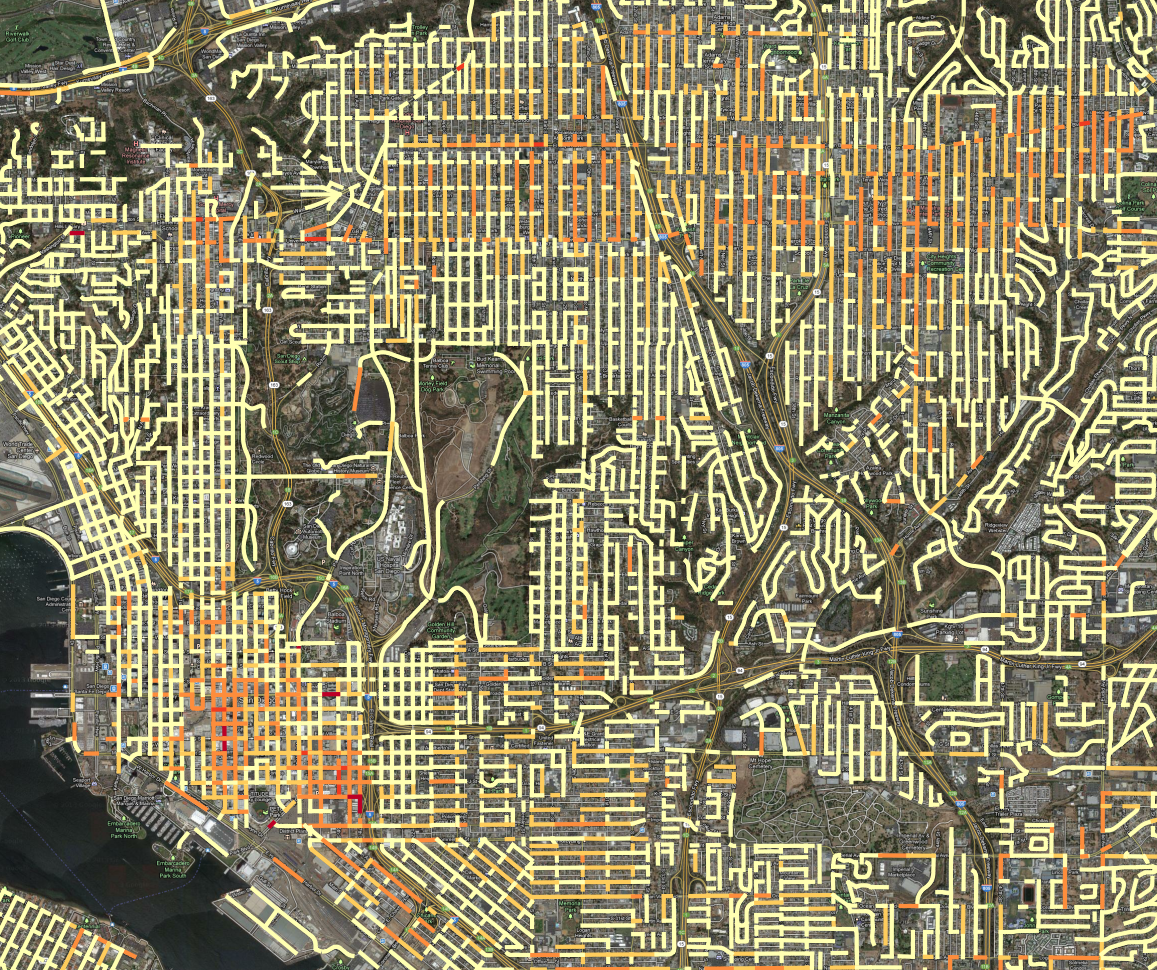
SANDAG / ARJIS Crime File Archive

For the last 5 months, SANDAG has been publishing their crime incident data to the web. The file they publish only stores the last 180 days, and it is a bit hard to find, so we’re archiving the files to our data repository .

Drugs and Alcohol in Downtown and East Villiage

For the last few months, a team of geography students at SDSU have been working with the crime data provided by the Library, producing analyses and visualizations of the data. Elias Issa has been looking at Drugs and Alcohol violations in Downtown San Diego and East Village. He writes: The Hot Spot tool calculates the  Gi* … Read more

SANDAG Is Now Publishing Crime Data Weekly

SANDAG, through its public safety division ARJIS, is now publishing crime data to the web. This is a major advance in accessibility, since previously crime incidents were only available through a Public Records Act request, and usually involved a fee. The download file includes crime incidents for the last 180 days. The Library will be … Read more

Visualizing Traffic Accidents

We recently converted the SWITRS database of traffic collisions in California, extracting the records for San Diego County and creating a basic visualization in Tableau Public. Tableau Public is a fantastic data analysis tool, although it takes a bit of training to do complex things. Below is a simple visualization of the number of people … Read more

Crime Data Update

We’ve released an update to the crime dataset today. This update is based on reprocessed data from SANDAG and includes some new fields. San Diego Crime Incidents, Revision 3 This update is based on a new extract of the data we got recently from SANDAG. They didn’t tell me what had changed, just that they … Read more

Visualizing Infrastructure with Balloon Animals

What if you got really creative with data visualization and represented the street lights of La Jolla and Pacific Beach with the balloons that are used to make animals? It might like like this:   This image is actually from a dataset I’ve created showing, for every 10m^2 area of the City of San Diego, … Read more

Six Years of Crime Data

Today we are releasing the processed version of six years of San Diego County crime data. We received this data last month from SANDAG, and have augmented the source data with city and and neighborhood codes. The data is released as both CSV and ESRI Shape files with one file per year. To download the data, visit … Read more

Crime at Street Segments

A few weeks ago, we received crime incident data from SANDAG for the years from 2007 to March of 2013. The data has the location of the crime listed as a “hundred block,” so a crime at 1435 Main street would be listed at 1400 Main. Since we don’t know where the crime occurred on the block – we … Read more

Population Density Maps

Here is some  eye candy, a population density map of Pacific Beach and surrounding neighborhoods. This map was created with a lot of Python code, using the 2010 census shapefiles for census blocks, setting a value for each block as the population of the block divided by the area of the block, and rasterizing all … Read more

TGIF Chula Vista, It’s Crime Minimum Day

Our resident data slinger sent me an initial analysis of time series data for specific crime hot spots in San Diego, and the results are interesting. Rather than look at the whole of the region at once, we’ve identified specific high intensity areas, and are doing time-series analysis for them independently. The major areas are: North Park, … Read more