
A few weeks ago, we received crime incident data from SANDAG for the years from 2007 to March of 2013. The data has the location of the crime listed as a “hundred block,” so a crime at 1435 Main street would be listed at 1400 Main. Since we don’t know where the crime occurred on the block – we don’t know the exact address – it makes sense to attribute the crime to the whole block. I just finished an initial pass at geocoding crimes to street segments, using the All_Roads file from SANGIS and lot of custom Python code. Here are the results:

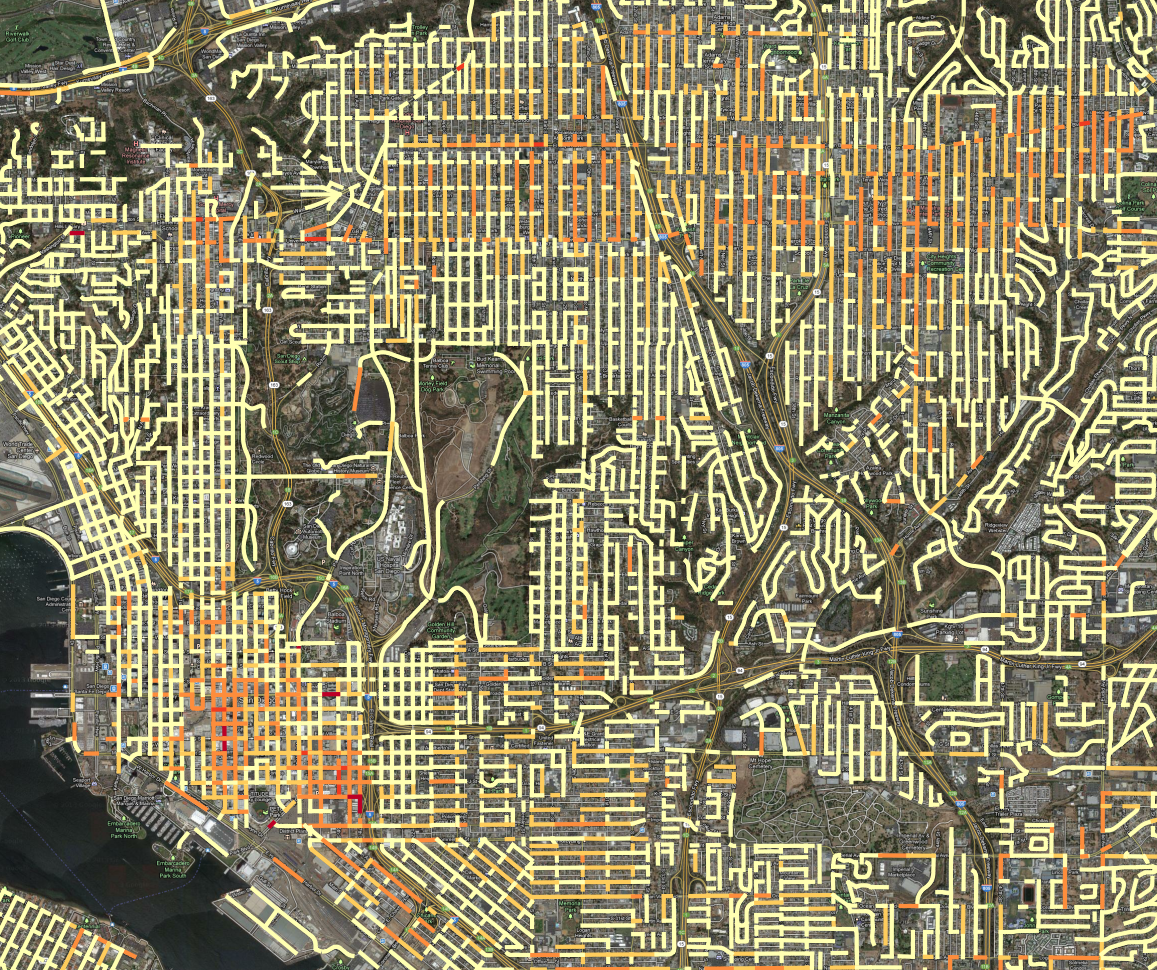
In this map, all of the crime incidents for the 6 year period are counted, grouped by the block where the crime occurred. Then, the counts are divided by the length of the street segment and the time period, so the final value is Crime per year per kilometer. Then, the range of values is broken into 5 groups, using the Jenks natural breaks. ( Using head/tail breaks would require more programming ) I tweaked the breaks manually to put more segments into the top category.
This presentation has an advantage over the previous maps we’d created, using Kernel Density Estimation to produce heatmaps: it is easier to see where high-crime blocks are. For instance, lets look at the red block east of downtown, due south of Balboa park. A crack house, perhaps?

Nope, it is the Police station. It is very common for crimes to have their address set to the police station if it isn’t clear what an appropriate address would be, such as for a car chase or someone caught in a canyon, like in this hotspot in Mission Gorge:

It isn’t likely that the particular segment of road gets a lot of crimes, and the criminals probably don’t live in the mobile home park. That segment of road probably contains the address number that is used for crime committed in Mission Gorge, it maybe it is where the cops like to park to patrol the canyon.
Here is a real hotspot, an empty lot that seems to be popular for drug use:

Compare this to the heatmap view, zoomed out to show the contour of the hotspot:

The heatmap works better at small scales, because you can quickly assess an entire region. At large scales, the street segment view can help isolate what a likely cause of the problem is, which can obscured by the large regions of the heatmap hotspots. The heat map also encourages a subtle psychological bias: the larger areas seem more significant, because our brains place a lot of emphasis on size. But in the segment map, the segments are viewed discretely, as qualities, not extents. So, it is easier to pay attention to unusual high intensity blocks which pop up because they are bright red, but which in the heatmap get ignored because they are small.
We’re not quite ready to publish the processed crime data, but should have it released, along with both kinds of maps, in the next week.