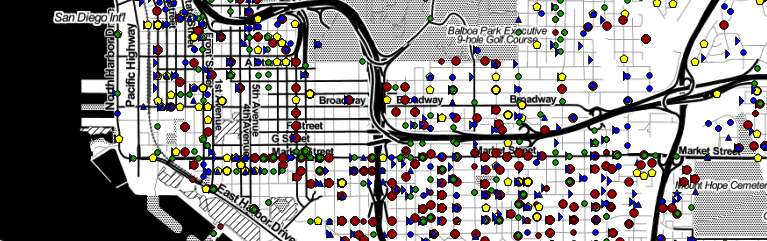
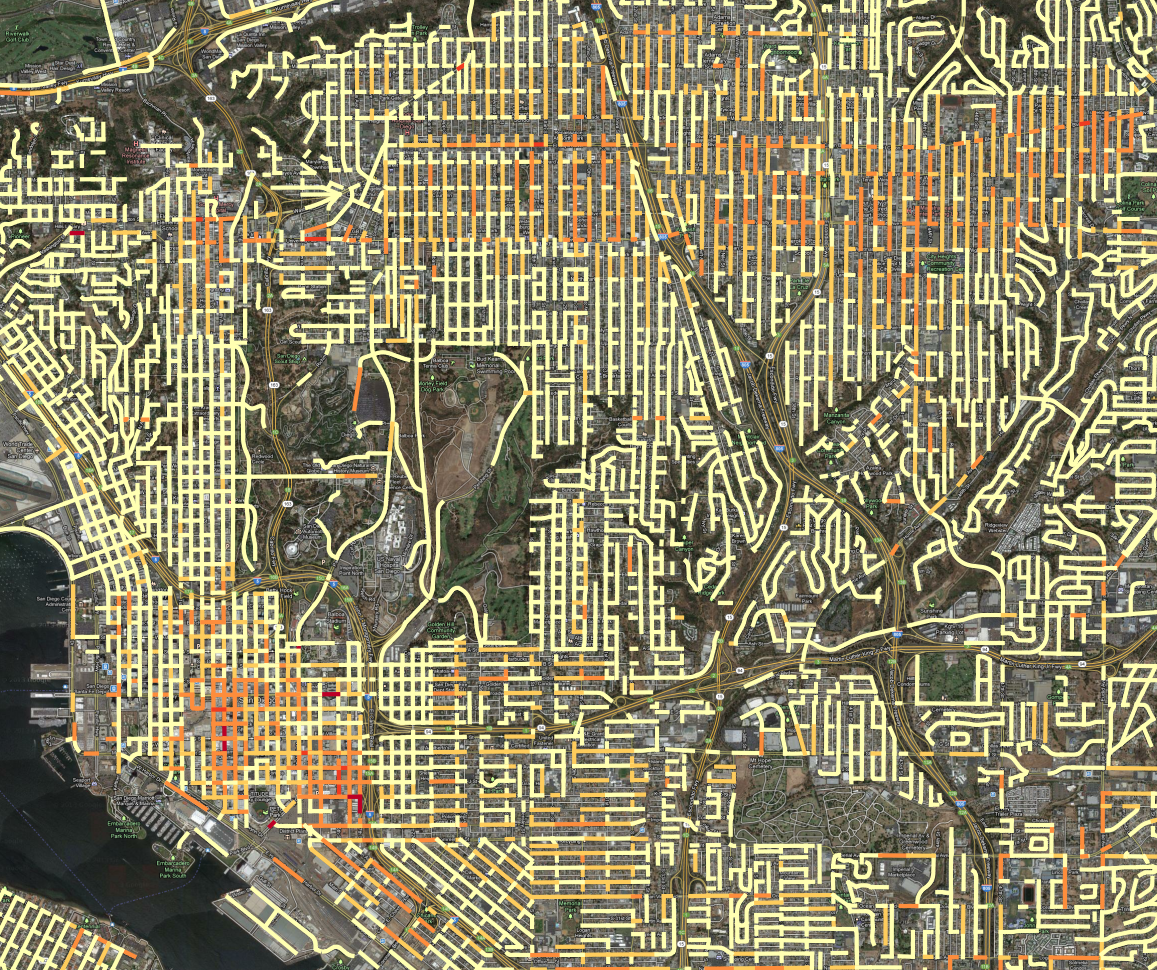
Visualizing Traffic Accidents

We recently converted the SWITRS database of traffic collisions in California, extracting the records for San Diego County and creating a basic visualization in Tableau Public. Tableau Public is a fantastic data analysis tool, although it takes a bit of training to do complex things. Below is a simple visualization of the number of people … Read more

Software For Data Analysis

For the Dig Into Data meetup this Wednesday, we’ll be talking about tools to use for analyzing data. If you’d like to follow along in the meeting, you can install these tools before you arrive. The two applications are: Tableau public, for analyzing tabular data. It is a great tool for basic data mining. QGIS, … Read more

Dig Into Data: Street Lights, Land Use and Crime

This Wednesday evening we will be meeting for a hands-on introduction to datasets related to city infrastructure, crime, landuse, business permits, and other factors. We will talk about how to use the data sets and how to analyze them using Excel, GIS tools and statistical programs. The contents will start mildly technical, with the most … Read more

Crime Data Update

We’ve released an update to the crime dataset today. This update is based on reprocessed data from SANDAG and includes some new fields. San Diego Crime Incidents, Revision 3 This update is based on a new extract of the data we got recently from SANDAG. They didn’t tell me what had changed, just that they … Read more

Visualizing Infrastructure with Balloon Animals

What if you got really creative with data visualization and represented the street lights of La Jolla and Pacific Beach with the balloons that are used to make animals? It might like like this:   This image is actually from a dataset I’ve created showing, for every 10m^2 area of the City of San Diego, … Read more

New Data Repository Released

Today we are releasing an update to our data repository, at http://data.sandiegodata.org. This release is based on CKAN 2.1, the same software used to run Data.Gov, one of the largest data sites in the world. The software is more capable than the older version, and it is much more attractive, with better visual design and organization.

Six Years of Crime Data

Today we are releasing the processed version of six years of San Diego County crime data. We received this data last month from SANDAG, and have augmented the source data with city and and neighborhood codes. The data is released as both CSV and ESRI Shape files with one file per year. To download the data, visit … Read more

Civic Hacking for the Greater Good!

Use your hacking skills for a better San Diego! Open San Diego, San Diego Code For America Brigade, Cali IT2,  and OpenGeo are sponsoring a Civic Day of Hacking.  The San Diego Regional Data Library will be presenting many of our datasets and running a crime analysis project, so join us if you’d like to … Read more

Worse than Singing about Economics: Inappropriate Visualizations

Of the many versions of the famous quote that “writing about music is like dancing about architecture” is that “writing about music is as illogical as singing about economics.” Both of these activities are actually quite common. Dancing about architecture is a sport of irony, and  not only are there songs about economics, the appropriately named … Read more

Crime at Street Segments

A few weeks ago, we received crime incident data from SANDAG for the years from 2007 to March of 2013. The data has the location of the crime listed as a “hundred block,” so a crime at 1435 Main street would be listed at 1400 Main. Since we don’t know where the crime occurred on the block – we … Read more