Visualizing Infrastructure with Balloon Animals
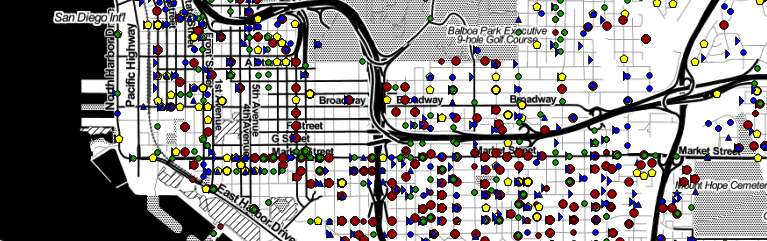
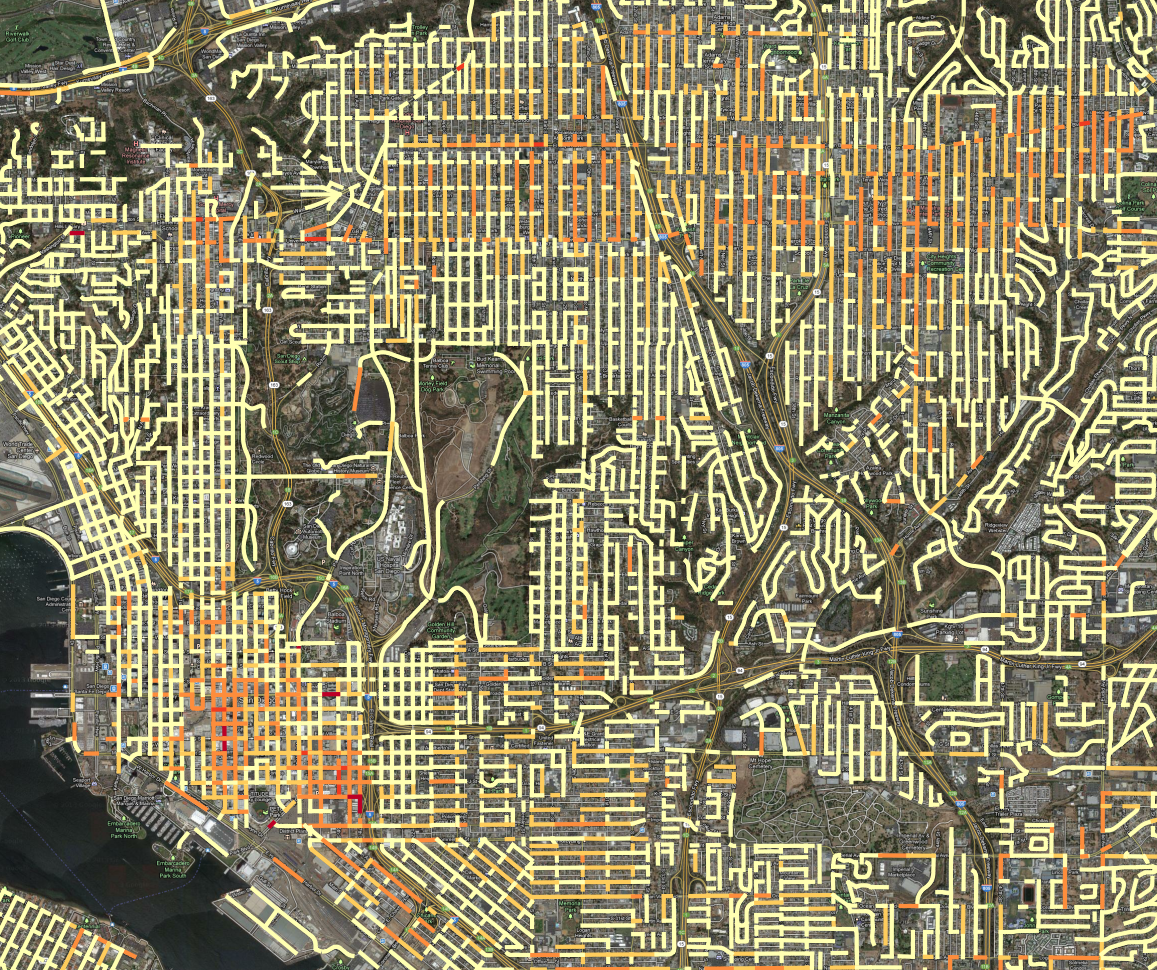
What if you got really creative with data visualization and represented the street lights of La Jolla and Pacific Beach with the balloons that are used to make animals? It might like like this: This image is actually from a dataset I’ve created showing, for every 10m^2 area of the City of San Diego, … Read more