San Diego Open Data Day

This weekend, Saturday Feb 23, is International Open Data Day, sponsored by the Open Knowledge Foundation, and it is also Code Across America data, sponsored by Code for America. San Diego is participating, hosted by Open San Diego, and the Library staff will be there to talk about the Library and our Crime Mapping Project. … Read more

XKCD Always Wins

I shouldn’t be surprised that for any interesting technical idea, XKCD covered it first, and better. Here is another view of the issue we covered regarding crime mapping: crime is most common where (a) there are a lot of people and (b) there is alcohol, and (b) is often the reason for (a).     To go … Read more

Property vs Violent Crime

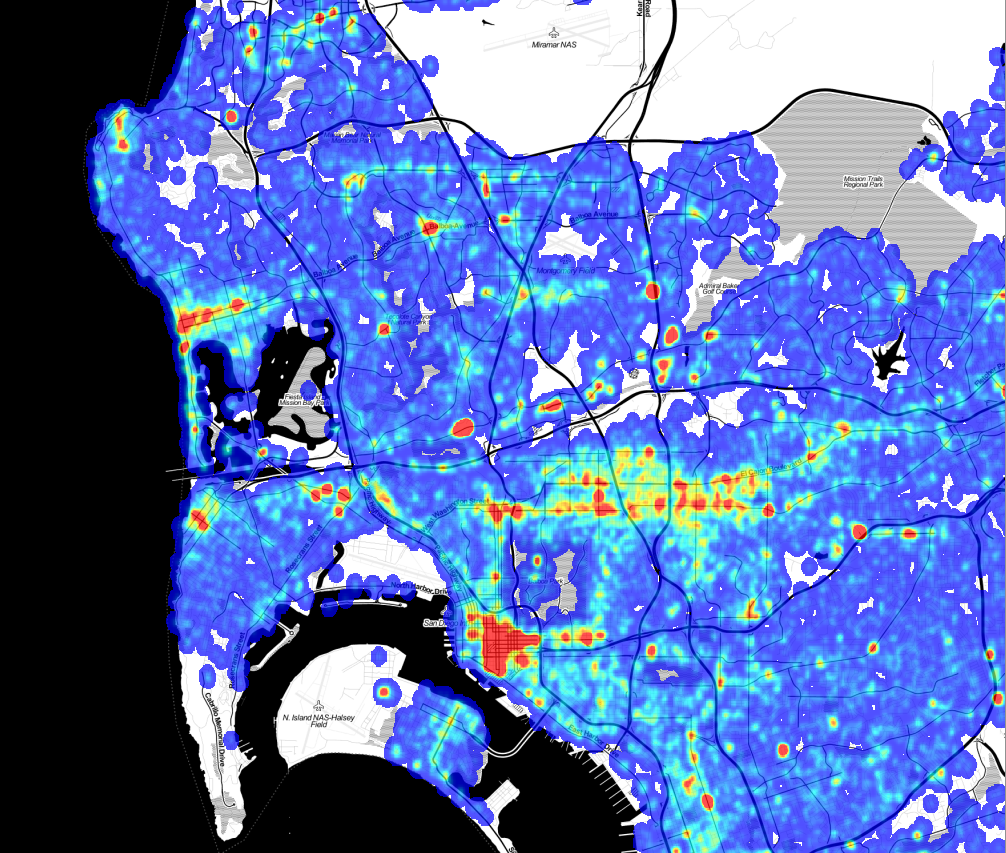
As part of our upcoming Crime Mapping project, we’ve started producing maps of San Diego area cime incidents, and have made a few interesting discoveries that we’d like to share. While these aren’t ground-breaking insights, the results do confirm intuition and offer some small surprises. A few months ago we received and processed the SpotCrime.com … Read more

Crime And Street Lamps

In preparing to formally launch the San Diego Regional Data Library, we’ve been spending a lot of time talking to nonprofits, community planing groups, city staff and city council members about their data needs. The staff for District 9 mentioned that Council member Marti Emerald is interested in infrastructure issues, particularly how crime is related … Read more

San Diego Civic Engagement

The Corporation for National and Community Service is a federal agency that encourages US citizens to volunteer, particularly for federal programs like AmeriCorps. They also have an excellent data site that provides statistics on civic engagement. We used their data extraction tool to pull a few datasets, which are posted on the Library’s data repository.  Here is … Read more

Visualize Civic Engagement

Cities thrive when citizens get directly involved in working for their city. Not only do engaged residents solve problems and guide development, but the fact they got involved makes them love their city more, and encourages the people they socialize with to also care more about their city. Because loving something and watching it grow just feels good, creating … Read more

That Map Does Not Mean What You Think It Means

Last week I showed a wonderful heat map of crime from Trulia, that made it more clear where crimes were actually occurring. Unfortunately, the map does not really have much information; anyone who lives in the area already knows where the crime is. To illustrate, compare the crime map: To this map: Suspiciously similar? The second … Read more

Faking a Map in Excel

  UXBlog has a wonderful guide  to making fake maps in Excel. The technique involves putting values from a dataset into bins by rounding latitude and longitude, so that each cell in the spreadsheet represents one degree of lat/lon. If the color of the cell is computed from  the number of datapoints that fall into each cell, the … Read more

Austin’s Commitment to Civic Innovation

As part of working with the City of San Diego to develop an Open Data Policy, I and others have proposed that the city create a position for a Chief Innovation Officer, a person dedicated to identifying and developing new ways for the City to accomplish it’s job. To get a better idea of what … Read more