SANDAG / ARJIS Crime File Archive

For the last 5 months, SANDAG has been publishing their crime incident data to the web. The file they publish only stores the last 180 days, and it is a bit hard to find, so we’re archiving the files to our data repository .

Day/Time Crime Heatmaps

Here is an interactive data application that explores how crime incidents vary over the day of week and time of day. In the checkbox below, select one or more crime types, and the heatmap will show the relative intensity of those crime types over day of week and time of day. There many interesting patterns … Read more

Drugs and Alcohol in Downtown and East Villiage

For the last few months, a team of geography students at SDSU have been working with the crime data provided by the Library, producing analyses and visualizations of the data. Elias Issa has been looking at Drugs and Alcohol violations in Downtown San Diego and East Village. He writes: The Hot Spot tool calculates the  Gi* … Read more

Why is Open Data Hard?

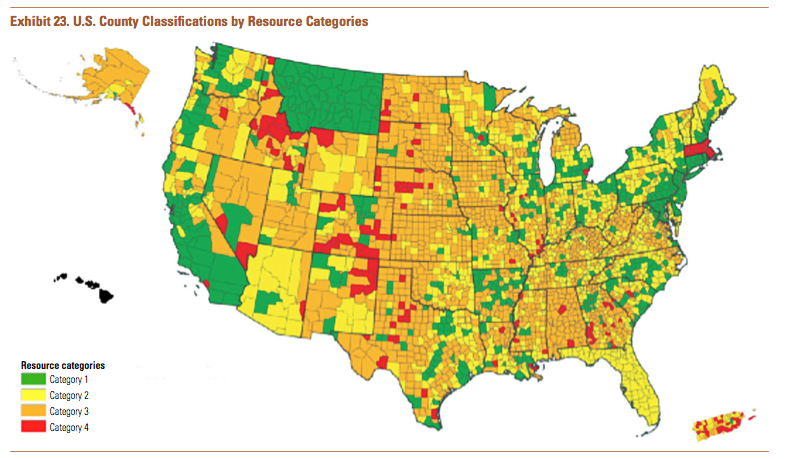
Last year, the U.S. Department of Housing and Urban Development commissioned a report to study the feasibility of creating a nationwide database of parcel information. This is a difficult task because the parcels are usually maintained by the counties, and the US has about 3200 counties. The resulting report is remarkably thorough, including a description of … Read more

Q&A On Open Data

The Voice of San Diego is running a Q&A regarding Open Data, which just happens to involve an interview with the Director of the Library.

SANDAG Is Now Publishing Crime Data Weekly

SANDAG, through its public safety division ARJIS, is now publishing crime data to the web. This is a major advance in accessibility, since previously crime incidents were only available through a Public Records Act request, and usually involved a fee. The download file includes crime incidents for the last 180 days. The Library will be … Read more

Visualizing Traffic Accidents

We recently converted the SWITRS database of traffic collisions in California, extracting the records for San Diego County and creating a basic visualization in Tableau Public. Tableau Public is a fantastic data analysis tool, although it takes a bit of training to do complex things. Below is a simple visualization of the number of people … Read more

Software For Data Analysis

For the Dig Into Data meetup this Wednesday, we’ll be talking about tools to use for analyzing data. If you’d like to follow along in the meeting, you can install these tools before you arrive. The two applications are: Tableau public, for analyzing tabular data. It is a great tool for basic data mining. QGIS, … Read more

Dig Into Data: Street Lights, Land Use and Crime

This Wednesday evening we will be meeting for a hands-on introduction to datasets related to city infrastructure, crime, landuse, business permits, and other factors. We will talk about how to use the data sets and how to analyze them using Excel, GIS tools and statistical programs. The contents will start mildly technical, with the most … Read more

Crime Data Update

We’ve released an update to the crime dataset today. This update is based on reprocessed data from SANDAG and includes some new fields. San Diego Crime Incidents, Revision 3 This update is based on a new extract of the data we got recently from SANDAG. They didn’t tell me what had changed, just that they … Read more