
In preparation for the Data Science for Non Profits meeting tomorrow night (Wednesday, 9 Oct), I’ve created a Google Colab notebook demonstrating how to access the homeless sleeper dataset and compare the distribution of homeless sleepers to crime, pedestrians and businesses. The main output is this chart ( click to expand).
[ To run this notebook, click on the “Open In Playground Mode”, or make a copy of it to your account. ]
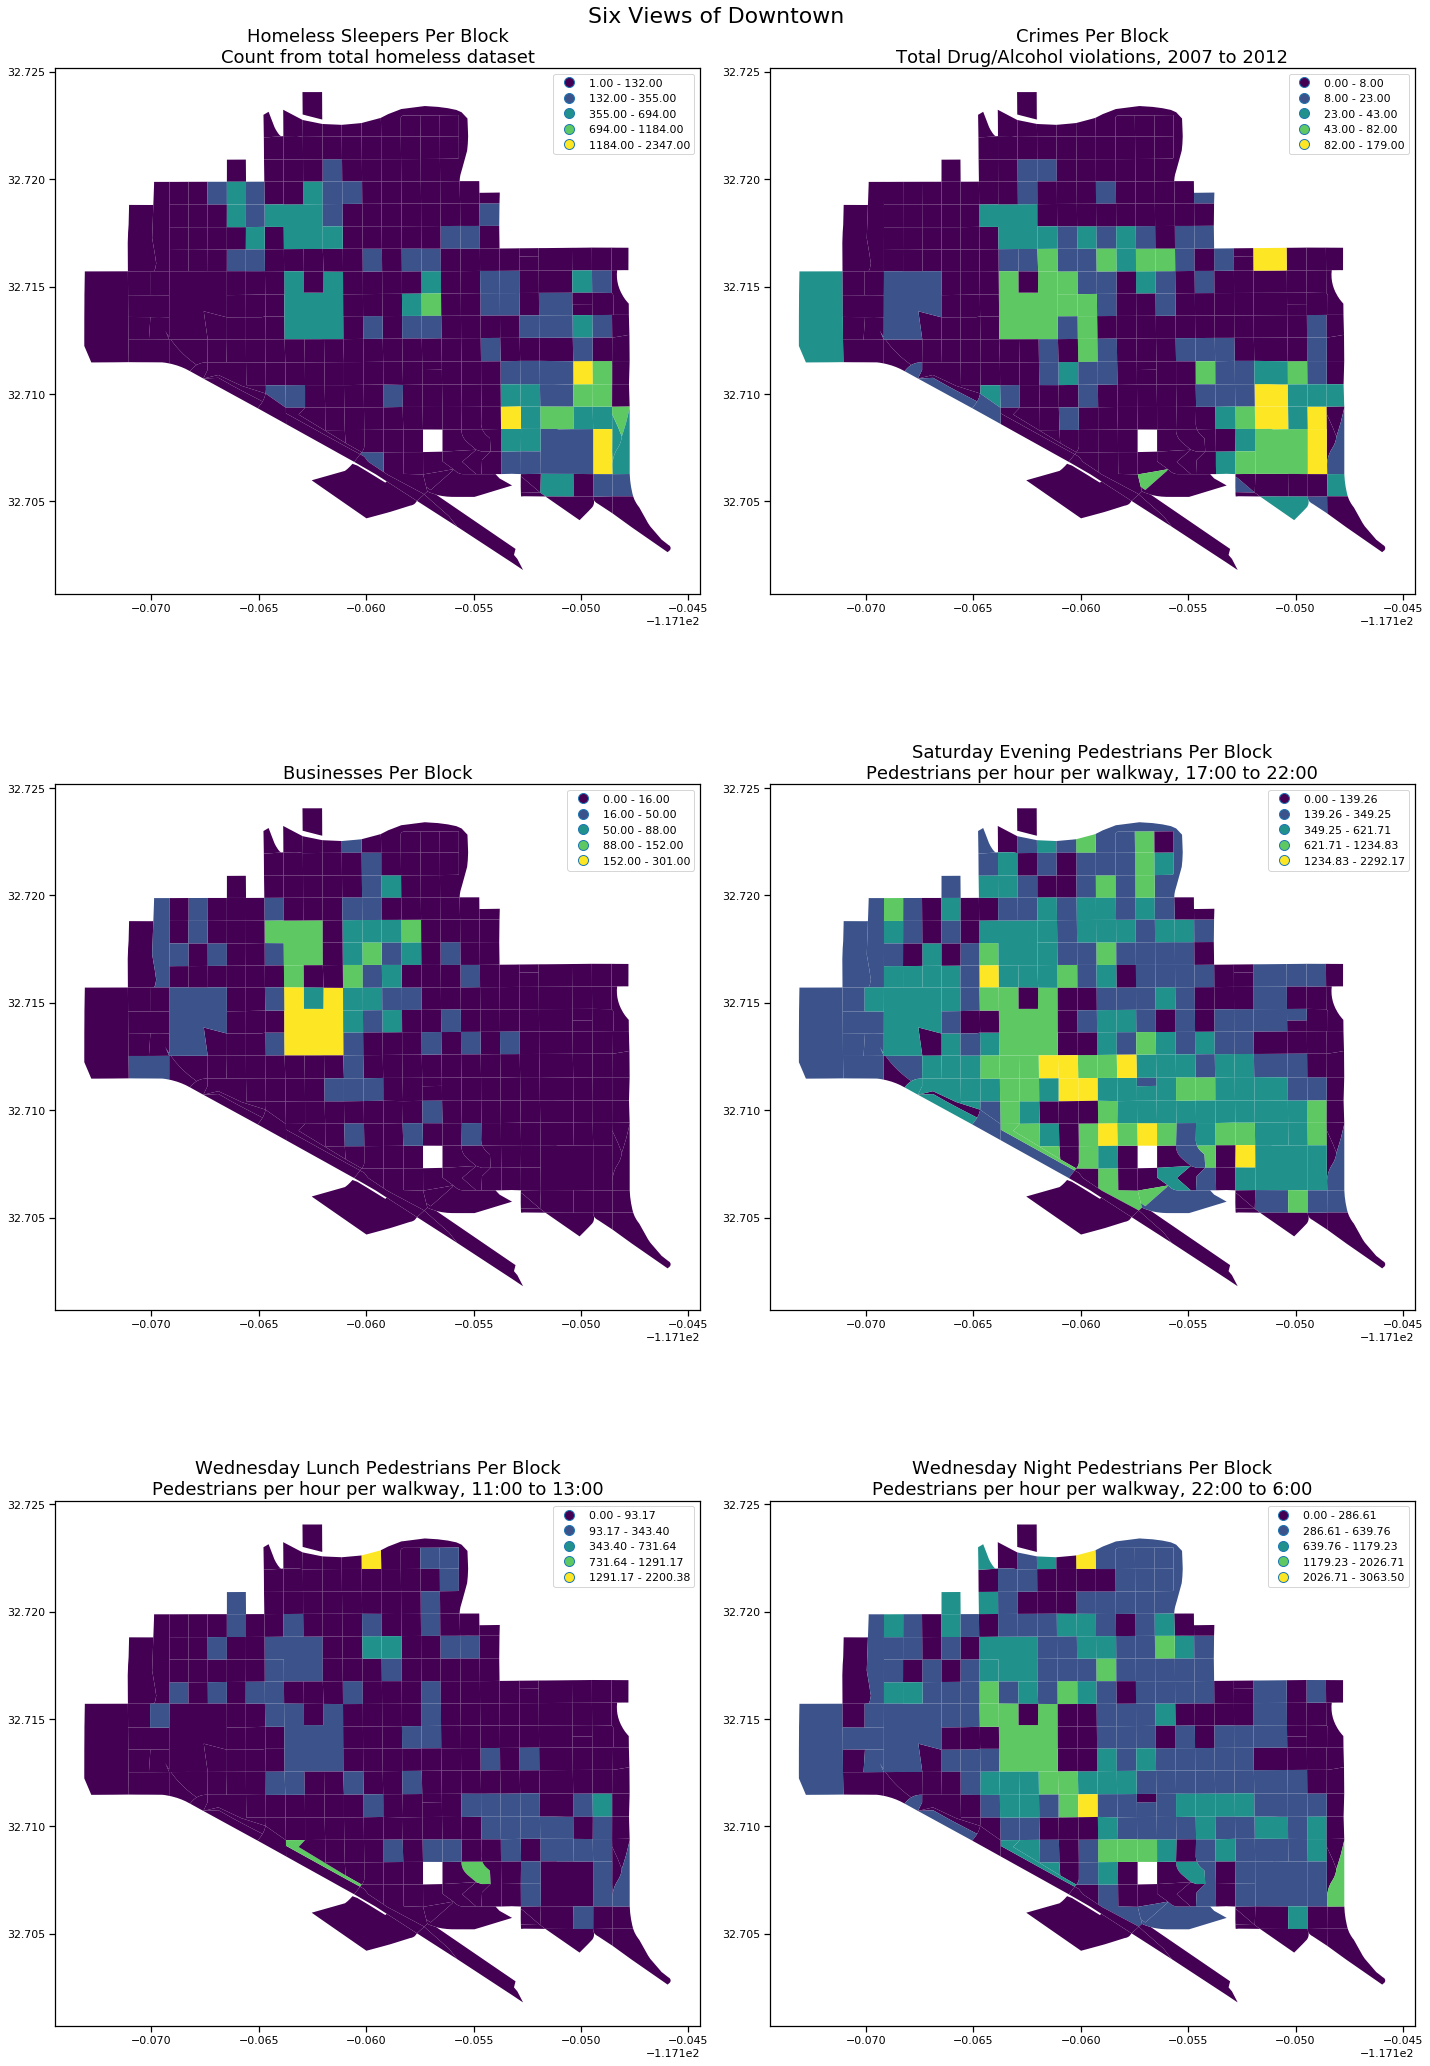
If you’d like a hands-on introduction in how to create maps like these, join us for the meetup tomorrow night.