The Library recently added a new dataset, a conversion of the data of reports to the City’s Get It Done program. The dataset includes reports of homeless encampments, so it it an interesting addition to other datasets we have with homeless position reports. Here is a heatmap of positions of reports. The orange dot is the peak value, centered at about Fault Line park in East Village.
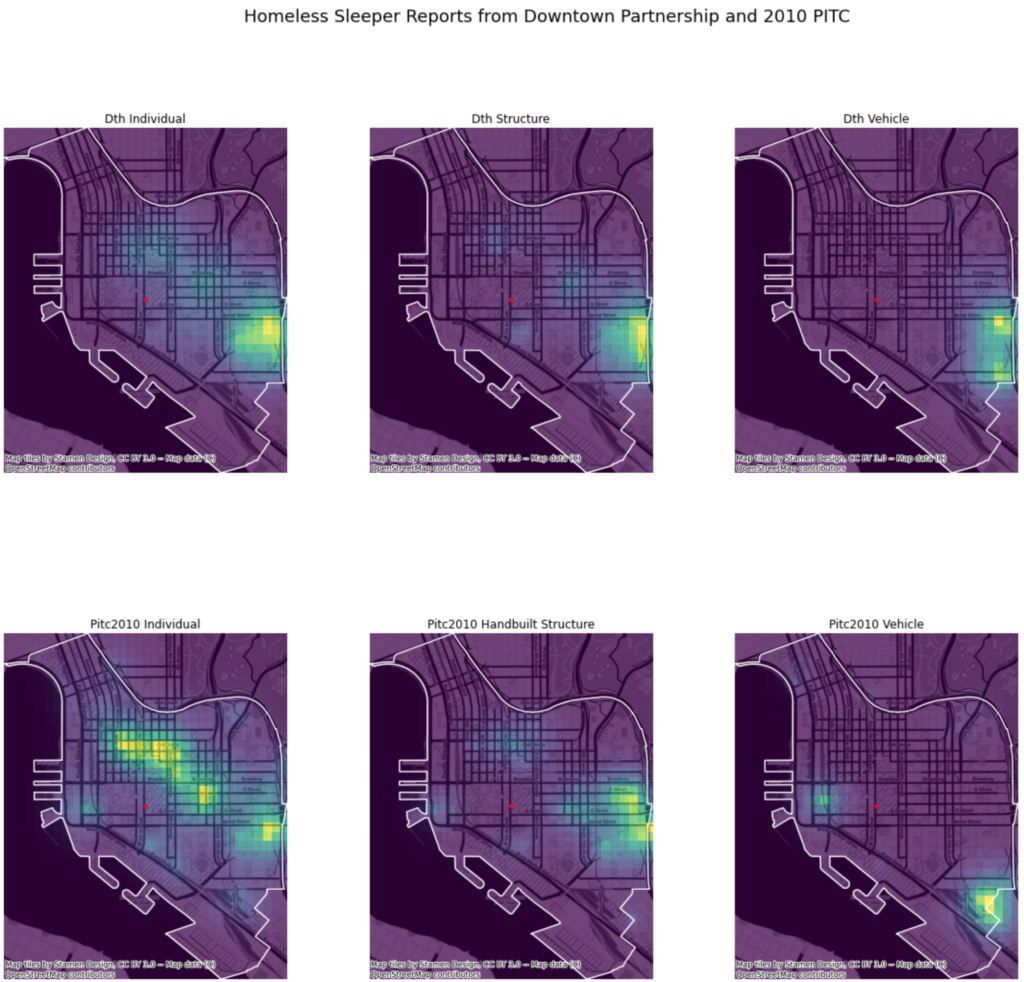
This map shows roughly similar results as two other datasets we have. In this image, the top three maps are from data from the San Diego Downtown Partnership, based on monthly counts of homeless sleepers, for individual sleepers, those in tents and other structures, and those in vehicles. The bottom three are from the 2010 Point in Time count, also for individuals, structures and vehicles. For individuals and structures, there is a consistent hotspot near Fault Line Park, although there is also a trend for individual sleepers to move from farther north to concentrate in East Village.


