
Data for Social Development
The San Diego Regional Data Library works with nonprofits, governments and journalists to answer data driven questions
Data Insights
Our Data Insights Service is a question and answer forum for data driven insights about San Diego area demographics, environment business and public safety issues. Ask a question for our analysts to solve, or contribute what you know with an answer.
Data Repository
The Data Repository holds data packages for a wide variety of topics, and larger collections for Education and Urban Planning
Connect With The Library
Follow us on Facebook, subscribe through Twitter, join meetings at Meetup.com, or join our mailing list.
Blog Posts
Homeless Encampment Reports
The Library recently added a new dataset, a conversion of the data of reports to the City’s Get It Done program. The dataset includes reports of homeless encampments, so it it an interesting addition to other datasets we have with homeless position…
Economic Development from Nighttime Lights
Study how business regulations affect economic development by analyzing satellite imagery.
San Diego Data Jobs Marketplace
San Diego data jobs marketplace, on the Data Science Alliance Slack channel.
Civic Tech Opportunity
If you are interested in civic technology and data, The Atlas is recruiting for a data engineer. The Atlas runs a network for state and local government officials to share best practices, and helps startups sell services to governments. A lot of…
SCALE Urban Innovation Challenge 2021
SCALE Urban Innovation Challenge 2021. Use your data, software and technology skills to help small businesses recover from COVID and thrive in 2021.
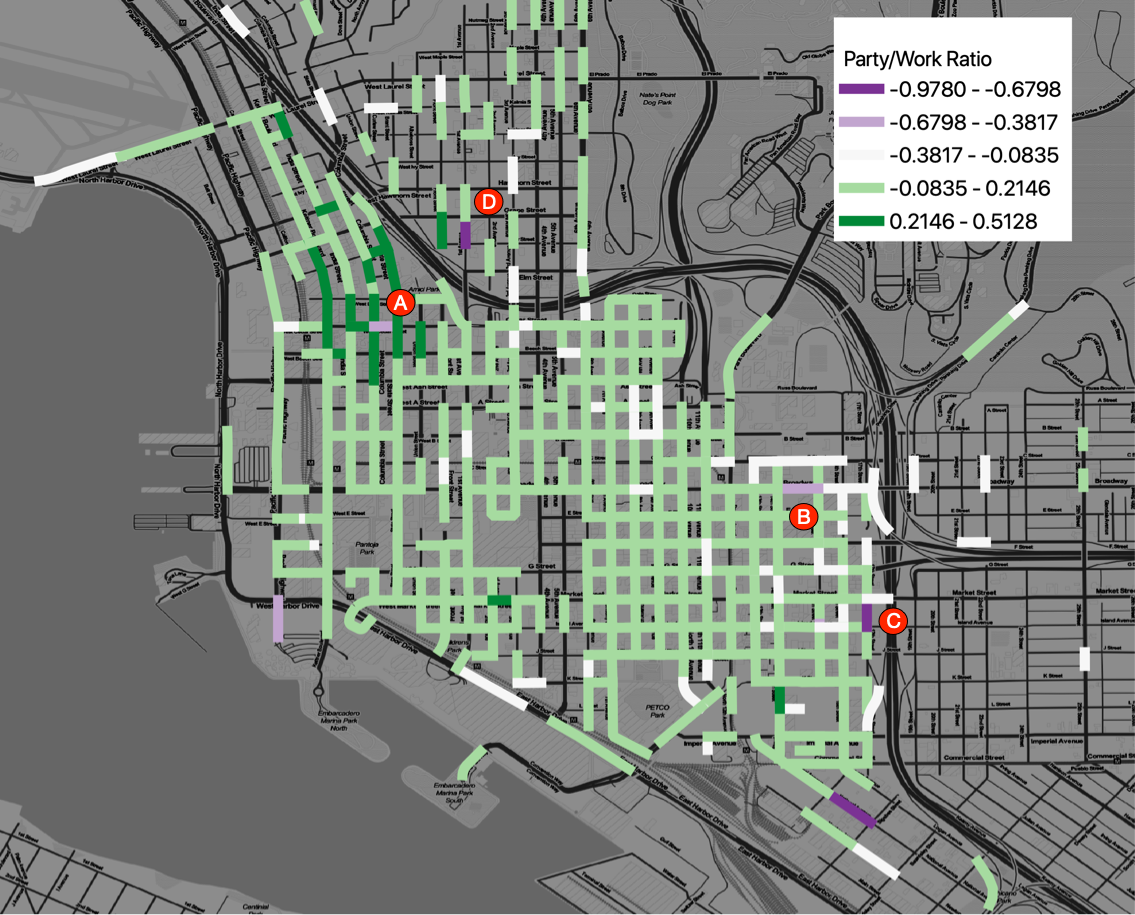
The Geography of Pacific Beach Business
This brief analysis examines the location of businesses in Pacific Beach, a residential neighborhood in San Diego with a very popular entertainment district.
Exploring Inequality with Survey Data
For tonight’s meetup about working with survey data to study inequality we will be working with data from the Survey of Consumer Finances in these two Google Colaboratory notebooks: Getting Started with the Survey of Consumer FinanceBasic SCL Descriptive Statistics The Data…
San Diego On-Sale Alcohol Permits
A map of the density of On-Sale alcohol permits, the permits required for serving alcohol at a bar or restaurant.
Getting Started with Crime Analysis
Next Tuesday the Data Library will be hosting a presentation on how to get started with analyzing crime data. https://www.meetup.com/San-Diego-Regional-Data-Library/events/274436132/ This will be a hands-on presentation, with demonstrations using multiple tools, including: Google ColaboratoryQGIS Tableau Public If you want to follow along,…
San Diego in Numbers, A Community for Data Questions and Answers
San Diego In Numbers is a project of the San Diego Regional Data Library that aims to help San Diegans get data driven insights about San Diego County. The project collects data questions from nonprofits, journalists and government agencies and organizes student…
Continue Reading San Diego in Numbers, A Community for Data Questions and Answers