How to Write a Good Data Question

Our Insights Service is a Question and Answer site for data questions, to make it easier for civic-minded San Diegans to better understand our local issues. However, it can be difficult to ask a good question that our analysts can answer. Here are some tips for writing a good data question. A good data question is specific and asks “when”, “how much,” “how many,” or “what is most”. It should have an answer that is something that is countable, usually a number of people, a number of dollars or the number of times something happened. The easiest questions to answer are formulated with a dataset in mind, or a hunch about what data you might find. Some places to find datasets that can help you understand what you can ask and get good answers for are:

Continue Reading →

Dig Into Data: Street Lights, Land Use and Crime

This Wednesday evening we will be meeting for a hands-on introduction to datasets related to city infrastructure, crime, landuse, business permits, and other factors. We will talk about how to use the data sets and how to analyze them using Excel, GIS tools and statistical programs. The contents will start mildly technical, with the most technical aspects towards the end, so if your analysis skills are basic statistics and Excel, you’ll benefit from the first half of the meeting, and if you are a geek or quant, stay for the whole presentation. To register, visit our meetup page. See you there!

Continue Reading →

Crime And Street Lamps

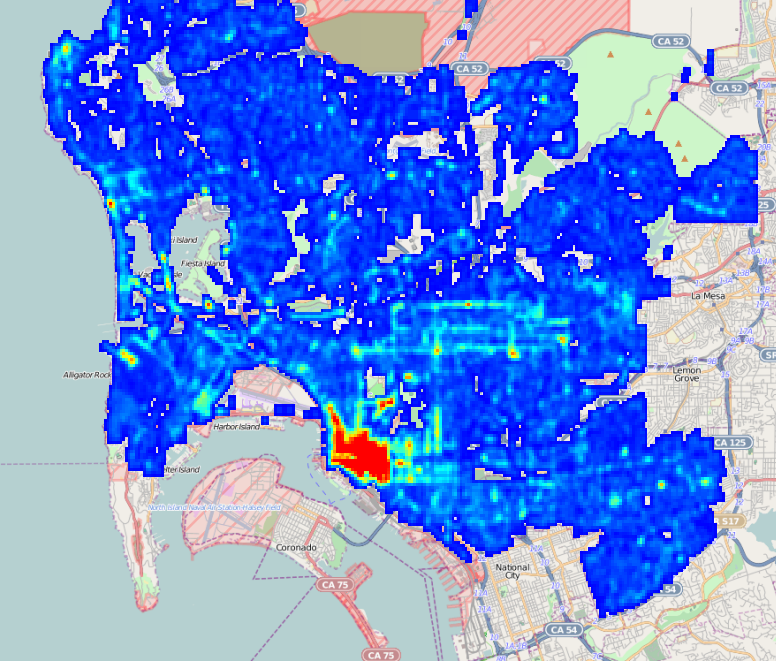
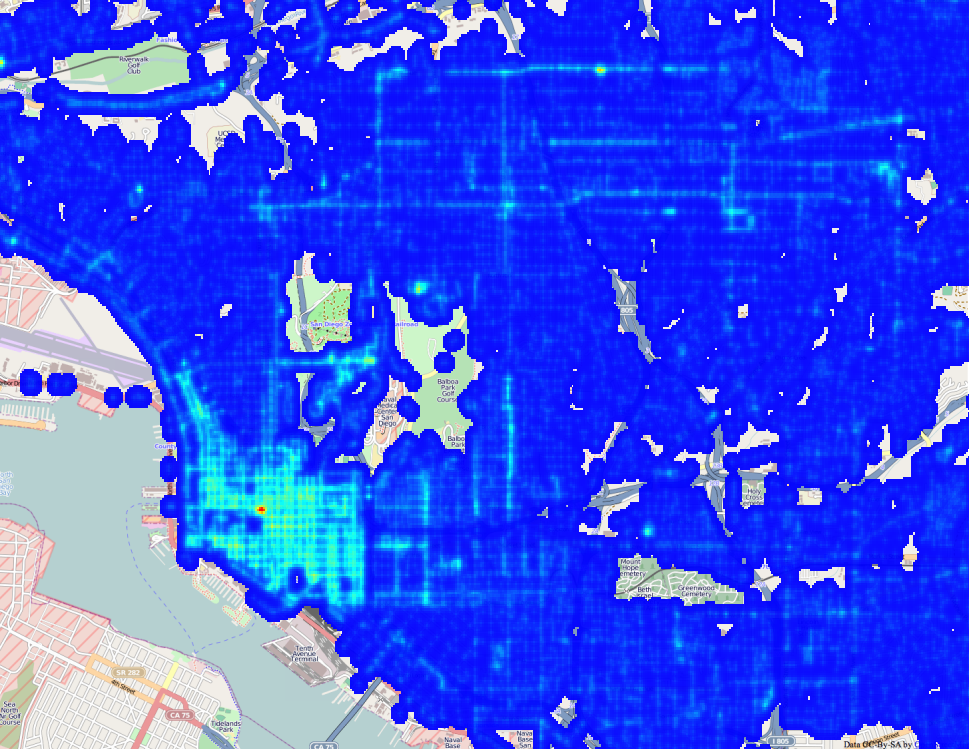
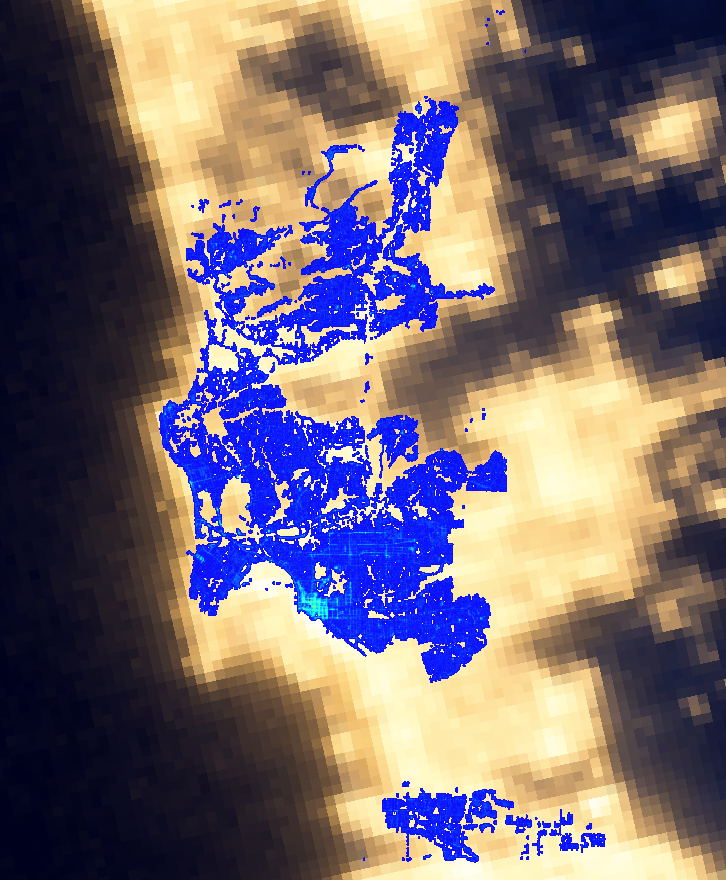
Street Light Density MapIn preparing to formally launch the San Diego Regional Data Library, we’ve been spending a lot of time talking to nonprofits, community planing groups, city staff and city council members about their data needs. The staff for District 9 mentioned that Council member Marti Emerald is interested in infrastructure issues, particularly how crime is related to infrastructure deficits. Her staff specifically mentioned street lamps. Fortunately, we have a fantastic resource in SanGIS, and they have published a shapefile with the locations of San Diego Street Lamps. So, we went to work extracting and processing street lamp data. Based on this data, we’re creating density maps of street lights, which we will correlate with crime incidents. The map shown here is one of the example maps we’ve produced, to experiment with how best to represent the data. For this map, I wrote a Data Bundle that converted the Shapefile of street lights provided by SanGIS into a Sqlite file, which was then loaded into an image. ( You can get the code for my bundle on GitHub. ) The processing code bins the location of the street lights to 1/4000 of a degree, about 18 meters at out latitude, then for each street lamp, adds a matrix onto the output image. The matrix spreads out the point, a bit like the light from the lamp would spread out. Here is a high resolution view of the output, showing Uptown, Downtown , the Park and Golden Hill. ( Click to expand ) Screen Shot 2013-02-10 at 1.57.29 PM This is, of course, a synthetic view of light in San Diego, but NASA has generated the real view, by photographing the earth at night. Here is our map laid over NASA’s image: Screen Shot 2013-02-10 at 2.01.19 PM Our data covers only San Diego, so there are many areas that are lit where we don’t have street lamp records, and it also appears that from space, light spreads much more than we estimate with our spreading matrix. Regardless, the maps show a good correspondence. This is a simplistic analysis, since it doesn’t consider the different types of lamps, their power, or the occlusion of buildings, but it does illustrate how to make and present a density map. This is the first step in our crime analysis project; the next steps will study how the locations of street lamps relate to the locations of crime. For the full project, we will have to consider that the correlation between crime and street lights isn’t only one way. There may be more crime in dark areas, but the city may also put more lights in high crime areas, breaking a simple correlation. So, we will probably focus on finding areas that are both dark and have high crime. If you like this sort of analysis, please join our Meetup group or connect though Facebook, Twitter or email to get the announcement for the start of our crime analysis project. We’d love to have your help!

Continue Reading →

That Map Does Not Mean What You Think It Means

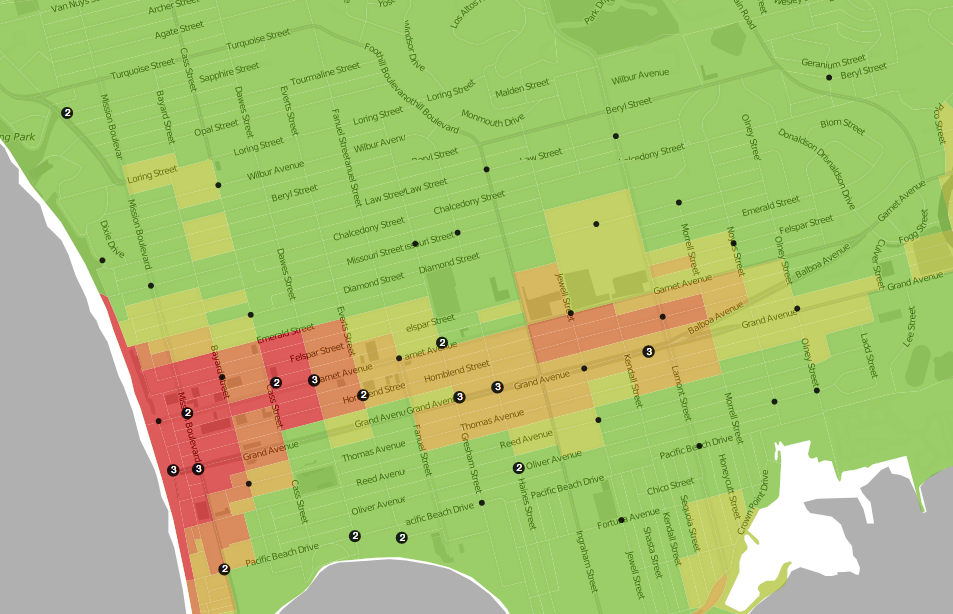
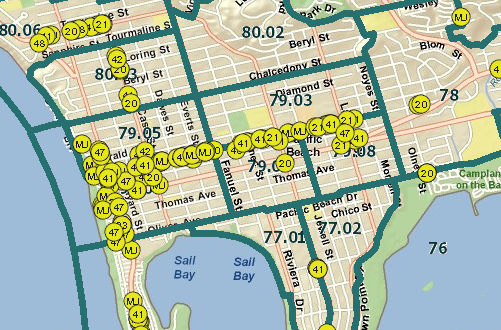
Last week I showed a wonderful heat map of crime from Trulia, that made it more clear where crimes were actually occurring. Unfortunately, the map does not really have much information; anyone who lives in the area already knows where the crime is. To illustrate, compare the crime map: Heat map of Pacific Beach, from Trulia.com Heat map of Pacific Beach, from Trulia.com To this map: Alcohol Permits in Pacific Beach Alcohol Permits in Pacific Beach

Continue Reading →

Faking a Map in Excel

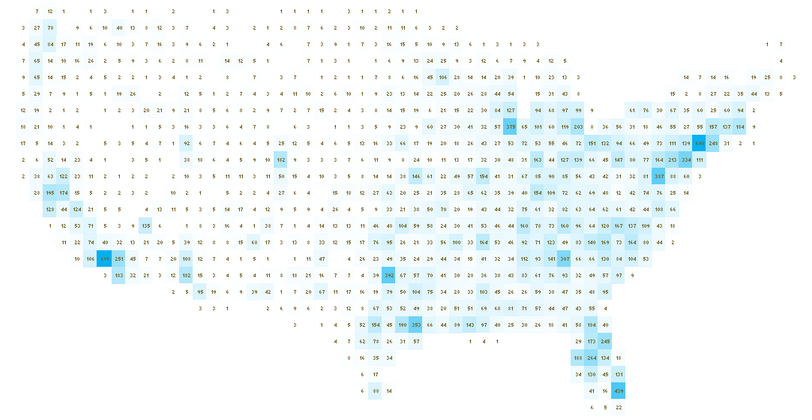
US Map Simulated in Excel. US Map Simulated in Excel. UXBlog has a wonderful guide to making fake maps in Excel. The technique involves putting values from a dataset into bins by rounding latitude and longitude, so that each cell in the spreadsheet represents one degree of lat/lon. If the color of the cell is computed from the number of datapoints that fall into each cell, the data will naturally represent a map.

Continue Reading →