
Homeless Encampment Reports

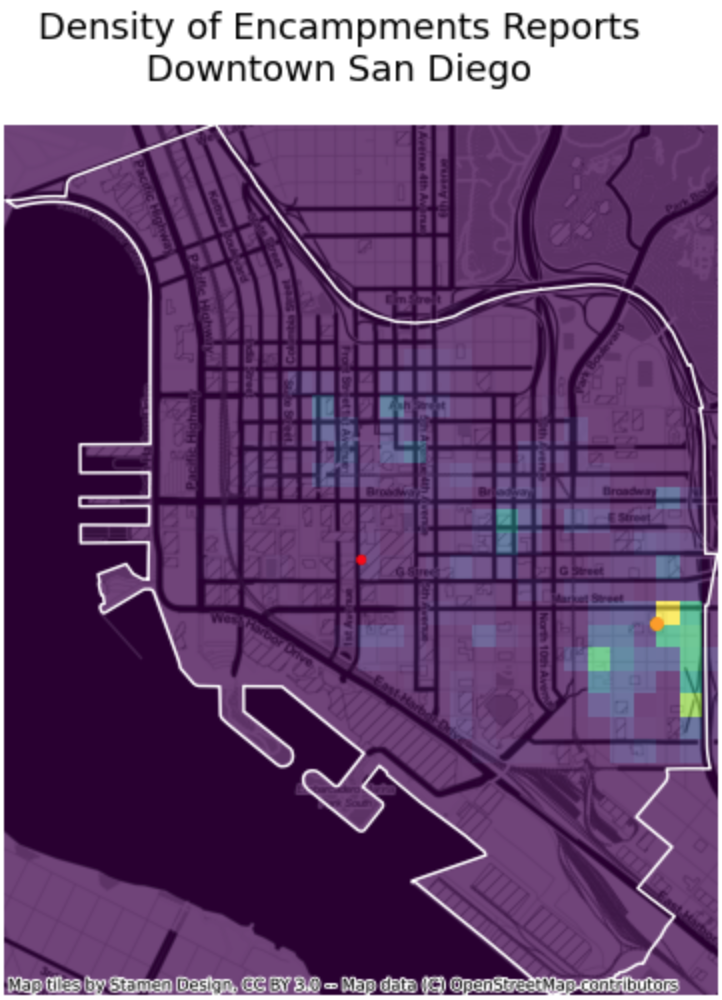
The Library recently added a new dataset, a conversion of the data of reports to the City’s Get It Done program. The dataset includes reports of homeless encampments, so it it an interesting addition to other datasets we have with homeless position reports. Here is a heatmap of positions of reports. The orange dot is the peak value, centered at about Fault Line park in East Village.
This map shows roughly similar results as two other datasets we have. In this image, the top three maps are from data from the San Diego Downtown Partnership, based on monthly counts of homeless sleepers, for individual sleepers, those in tents and other structures, and those in vehicles. The bottom three are from the 2010 Point in Time count, also for individuals, structures and vehicles. For individuals and structures, there is a consistent hotspot near Fault Line Park, although there is also a trend for individual sleepers to move from farther north to concentrate in East Village.

Continue Reading →

Economic Development from Nighttime Lights

The Charter Cities Institute is helping governments worldwide kick start economic development by building new cities with new rules. They’ve asked us for help with proving that changes in business regulations can increase employment, wages and other important social factors by studying Special Economic Zones, which have similar changes in rules but are much smaller.

To do this analysis, we will be linking a dataset of special economic zones to satellite images of nighttime lights in a project that combines geographic data, raster images, statistics and data science. If you are interested in joining the project, join us for the kick off meeting this Thursday, and signup for the project by creating an account on our project management site. You can learn more about the project at the project website.

Continue Reading →

Civic Tech Opportunity

If you are interested in civic technology and data, The Atlas is recruiting for a data engineer. The Atlas runs a network for state and local government officials to share best practices, and helps startups sell services to governments. A lot of the system in involves technology case studies that illustrate best practices around tech implementations and allow users to post questions to crowdsource ideas.
See their job posting for more details.

Continue Reading →

SCALE Urban Innovation Challenge 2021

SCALE, San Diego’s accelerator for civic and social technologies, is announcing their 2020 Urban Innovation Challenge. Start thinking about ways you can use your tech skills to help San Diego small businesses and visit the SCALE website for program details.

SCALE (Smart Cities Accelerator, Labs + Environment) San Diego is excited to announce the kick off of our Urban Innovation Challenge 2021 - the Innovation Sprint Week on April 5. This year’s urban innovation challenge is about helping small businesses thrive in our communities with data and technology. We’re calling all problem solvers, innovators, software developers, data scientists, designers, social entrepreneurs and others, who want to participate in the challenge. Over the last year small and micro businesses have been hit particularly hard. Many of them need new technology tools that can help them streamline their operations and win more customers. Here’s where you come in. You’re eager to solve challenges, can put yourself in the shoes of small business owners, can think outside the box and come up with innovative solutions using data and technology. Join SCALE San Diego Urban Innovation Sprint Week on April 5-11. Learn more and sign up here: scalesd.org

Continue Reading →

Exploring Inequality with Survey Data

For tonight’s meetup about working with survey data to study inequality we will be working with data from the Survey of Consumer Finances in these two Google Colaboratory notebooks:

The Data Library also has an extract file of the data used in these notebooks, which you can download to replicate the analyses in a different environment.

Continue Reading →

Getting Started with Crime Analysis

Next Tuesday the Data Library will be hosting a presentation on how to get started with analyzing crime data.

https://www.meetup.com/San-Diego-Regional-Data-Library/events/274436132/

This will be a hands-on presentation, with demonstrations using multiple tools, including:

If you want to follow along, click on the links above and QGIS and Tableau. For Google Colaboratory, you can also use Jupyter Notebook, which is usually best to run via Anaconda.

Here are links to the data package we will be using, along with the names of the individual datasets:

Continue Reading →

San Diego in Numbers, A Community for Data Questions and Answers

San Diego In Numbers is a project of the San Diego Regional Data Library that aims to help San Diegans get data driven insights about San Diego County. The project collects data questions from nonprofits, journalists and government agencies and organizes student and volunteer professional analysts to answer them. The best answers will be written up in chart and graph packed blog posts that cover important topics such as homelessness, land use, policing, water quality and many other topics that San Diegans care about.

Continue Reading →

COVID-19 Disaster Depends on the Difference of One Day

One of the simplest models of infection is the SIR model, a set of differential equations that describes how people in a population infect each other and eventually recover, transitioning between three compartments, from Susceptible to Infected to Recovered, although, because the model uses “Recovered” as the category for people who have died, some people refer to the R as “Removed.” It is a very simplistic model that assumes that every person in the population is equally likely to run to anyone else, so it is much more suitable for the State Fair or Chochella than it is for a real society, but it does offer an easy way to explore how infections work, in the abstract.

Continue Reading →

Has San Diego's Coronavirus Accounting Changed?

The three coronavirus metrics that most jurisdictions are publishing are cases, hospitalizations and deaths. The number of cases depends on the extent of testing, but the number of hospitalizations and deaths do not, at least not to the same extent, because while there are a lot of people who may have an infection and not get tested, testing is much more common for people who are hospitalized, and hospitalization most frequently precedes a death. Hospitalizations and deaths do, however, depend to some extent on the guidelines that are used to determine what qualifies as a coronavirus case.

Continue Reading →