
Of the many versions of the famous quote that “writing about music is like dancing about architecture” is that “writing about music is as illogical as singing about economics.” Both of these activities are actually quite common. Dancing about architecture is a sport of irony, and not only are there songs about economics, the appropriately named Merle Hazard has dedicated a career to it. There is even a stand up economist, who is quite funny, if you can understand the jokes. I propose that the next version of the quote involve something that actually is ridiculous and should not be done, inappropriate visualizations, of which I think I have found an excellent example: a heatmap of benchmarks. Benchmarks are the metal medallions that surveyors place in sidewalks and mountain tops to provide a repeatable location for surveying. They are stamped with numbers and named, and if you are surveying, it is important to know where they are so you can easily find them. It is natural, then, to want a map of their locations: 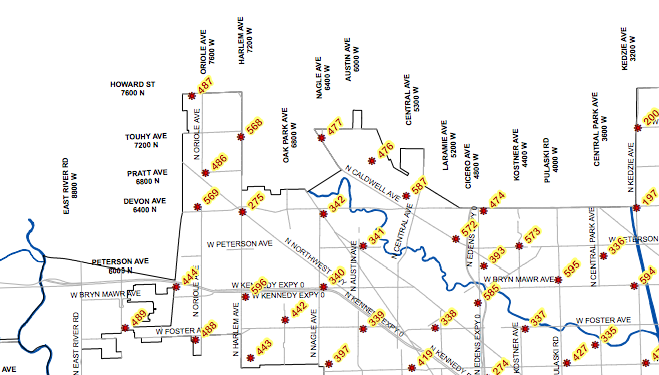 Portion of benchmark map for Chicago. While you might want to know where the benchmarks are located, it is highly unlikely that you would every want to know the areal density of benchmarks. There is probably no one who has asked what part of the city has the most benchmarks per square meter. No one cares what is the probability of finding a benchmark when they look down. And yet, the Chicago data repository has a heatmap of benchmarks:
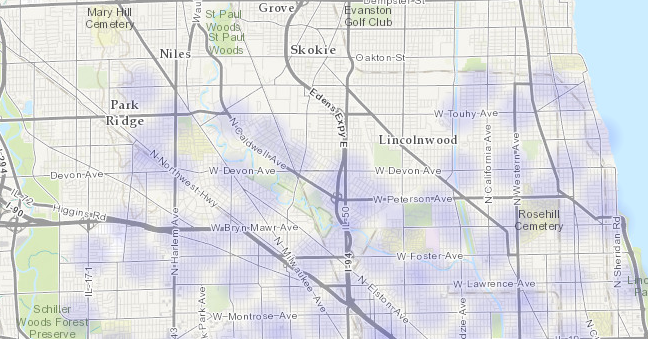 Heatmap of Chicago benchmarks. This map is generated by Socarata, the software that Chicago uses for it’s data repository, so it was probably very easy to create. It’s possible that a user happened to look as the base datafile, clicked on a button to create the heatmap, and the software automatically made it available to the public. Regardless, this presentation, and others like it, is useless, and it clutters up the repository, obscuring the data that people actually want. This is why our organization has “Library” in the name: I want to emphasize that there should be a person, a librarian, who talks to users and then makes decisions about how to present the data collection. It’s the difference between a well ordered research library and a pile of books in a warehouse. We’re not there yet ( our repository is a bit of a mess, sorry ) but that is the goal.
New Data: XKCD Didn't Win
An earlier post commented on an XKCD cartoon that was related to a common misinterpretation of crime maps, and I’d noted that it would be interesting to find the difference between the maps, as we had done for violent and property crime. Some of us think about interesting things, and others do them, Paul Breed sent in this difference analysis. 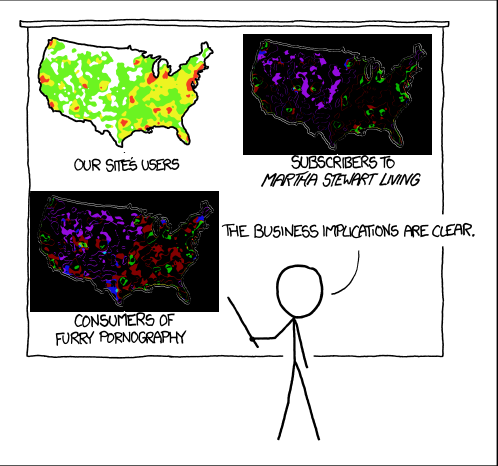 Purple is more “our site’s users”, and Green is more Martha and pornography. If the stick figure had done a little more analysis, he’d have discovered that there is no business implication.
XKCD Always Wins
I shouldn’t be surprised that for any interesting technical idea, XKCD covered it first, and better. Here is another view of the issue we covered regarding crime mapping: crime is most common where (a) there are a lot of people and (b) there is alcohol, and (b) is often the reason for (a). 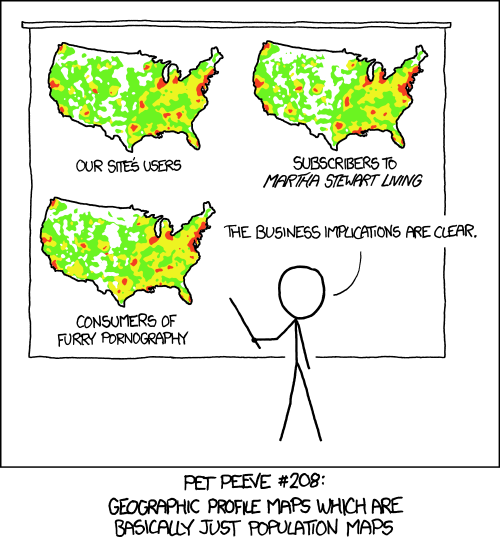 To go ahead and ruin the joke with over analysis, the maps in the cartoon aren’t exactly the same. So, it might be interesting to subtract them from each other and explore the differences.