The Data Library works primarily with journalists and nonprofits, but until recently, I hadn’t fully realized how different the processes are in these two environments. We’d been following two different processes, but didn’t have names for them, so it is worthwhile to give the two contexts names, so we can be sure we are working in a process that is comfortable for our clients and partners. In the Journalist / Exploratory context, the journalist is looking for a story in data, or wants to use data to support a story idea. In either case, the dataset is novel; there is no pre-existing format to follow, and most times, neither the journalist nor the analyst has worked with the data before. In this context, we follow a light, fast process that produces a lot of graphs and tables to look at different angles. The outputs are very rough, so the plots aren’t properly labeled and table columns can be cryptic. The goal is to sift through the data quickly to find a few gems, and polish them later. We don’t want to spend a lot of time making plots look good if they will never be used. In this context, we will work directly from IPython and plotly, documenting the process in Google Docs, and will share with the journalist the IPython Notebooks, which like this one, are complicated, ugly, and not at all suitable for publication, but they are very useful for exploring ideas quickly. The other context is the Nonprofit / Reporting context, where an organization has a fairly specific goal, most often a well defined report. In this context, the projects run most smoothly when we start with a copy of a previous report, discuss changes to it, and use it as a template. If there isn’t a previous report, we’ll mock up one in Excel first. In the reporting context, the client doesn’t want to see the rough work, and the IPython notebooks are very confusing and distracting, so we usually share Excel files for data, and load the data into Tableau for presentation and discussion. The Tableau workbooks are much easier to understand, and a whole lot more attractive. Here is an example of a Tableau workbook organized for reporting. There are other contexts as well, one for programming projects and another for producing datasets for later analysis, but these are the two where proper communication about which context will be used for a project has the most impact on project success.
The Cost of Cleaning
We’ve frequently mentioned that people who work on data projects tell us that frequently, 80% of their projects are consumed by data preparation and cleaning, so it is interesting to get this data point from Kaggle:
(2) How long is a typical project? When working with a top 0.5% data scientist, projects take just eight to 40 hours ($3k to $12k). Projects are finished in closer to eight hours for clean data and closer to 40 hours when the data requires cleaning.
Worse than Singing about Economics: Inappropriate Visualizations
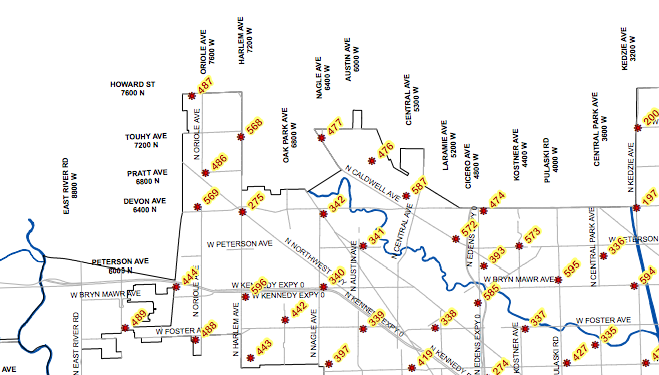
Of the many versions of the famous quote that “writing about music is like dancing about architecture” is that “writing about music is as illogical as singing about economics.” Both of these activities are actually quite common. Dancing about architecture is a sport of irony, and not only are there songs about economics, the appropriately named Merle Hazard has dedicated a career to it. There is even a stand up economist, who is quite funny, if you can understand the jokes. I propose that the next version of the quote involve something that actually is ridiculous and should not be done, inappropriate visualizations, of which I think I have found an excellent example: a heatmap of benchmarks. Benchmarks are the metal medallions that surveyors place in sidewalks and mountain tops to provide a repeatable location for surveying. They are stamped with numbers and named, and if you are surveying, it is important to know where they are so you can easily find them. It is natural, then, to want a map of their locations:
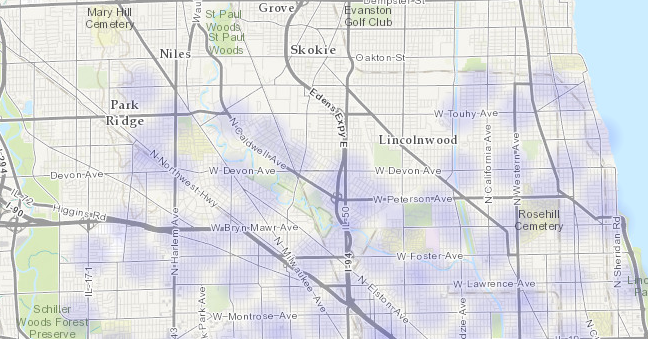
Portion of benchmark map for Chicago. While you might want to know where the benchmarks are located, it is highly unlikely that you would every want to know the areal density of benchmarks. There is probably no one who has asked what part of the city has the most benchmarks per square meter. No one cares what is the probability of finding a benchmark when they look down. And yet, the Chicago data repository has a heatmap of benchmarks:
Heatmap of Chicago benchmarks. This map is generated by Socarata, the software that Chicago uses for it’s data repository, so it was probably very easy to create. It’s possible that a user happened to look as the base datafile, clicked on a button to create the heatmap, and the software automatically made it available to the public. Regardless, this presentation, and others like it, is useless, and it clutters up the repository, obscuring the data that people actually want. This is why our organization has “Library” in the name: I want to emphasize that there should be a person, a librarian, who talks to users and then makes decisions about how to present the data collection. It’s the difference between a well ordered research library and a pile of books in a warehouse. We’re not there yet ( our repository is a bit of a mess, sorry ) but that is the goal.
Report: Municipal Open Data Policies
We’ve released a new report, Municipal Open Data Policies. The best way to ensure that San Diego area nonprofits and citizens get useful data is for local governments to adopt Open Data policies. These policies, which have been implemented in many cities around the country, mandate that cities publish data. So, instead of fighting for months to get data through a Public Records Act request, you can just download what you want from a website. Our latest report, Municipal Open Data Policies, analyzes 10 documents from other cities and breaks down their components, to create a guide for our own leaders to use when crafting similar policies for San Diego. Open Data policies are increasingly popular because they are powerful commitments to openness and have a broad range of benefits to citizens, social organizations and civic groups. With more open data, everyone in the region can work together to improve our communities. That’s a future that the San Diego Regional Data Library is working toward, and one that our governments can support by adopting Open Data Policies.
TGIF Chula Vista, It's Crime Minimum Day
Our resident data slinger sent me an initial analysis of time series data for specific crime hot spots in San Diego, and the results are interesting. Rather than look at the whole of the region at once, we’ve identified specific high intensity areas, and are doing time-series analysis for them independently. The major areas are: North Park, Chula Vista, Gaslamp and Pacific Beach. Since each of these areas is very different, they have different crime profiles, so we’re analyzing them separately. Here is the map for the Chula Vista analysis area:
XKCD Always Wins
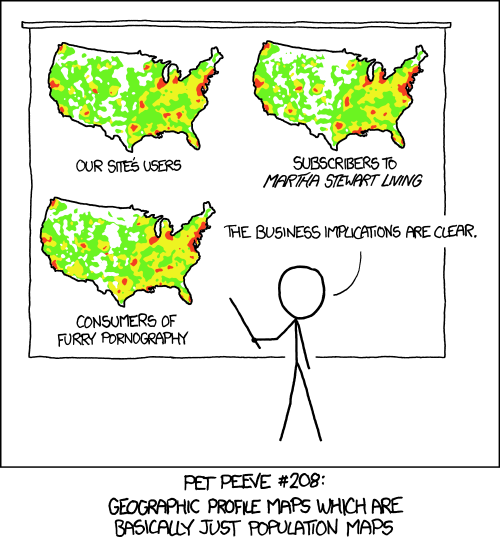
I shouldn’t be surprised that for any interesting technical idea, XKCD covered it first, and better. Here is another view of the issue we covered regarding crime mapping: crime is most common where (a) there are a lot of people and (b) there is alcohol, and (b) is often the reason for (a).
To go ahead and ruin the joke with over analysis, the maps in the cartoon aren’t exactly the same. So, it might be interesting to subtract them from each other and explore the differences.
Visualize Civic Engagement
Animated map of Bikeshare station utilization. Cities thrive when citizens get directly involved in working for their city. Not only do engaged residents solve problems and guide development, but the fact they got involved makes them love their city more, and encourages the people they socialize with to also care more about their city. Because loving something and watching it grow just feels good, creating opportunities for city residents to improve their communities has benefits both for the place and for the person. Both Boston and Washing DC have popular bikeshare systems. Massachusetts’ is called Hubway, and in DC it is called Capital Bikeshare. Both are using a system operated the company Alta Bike Share, and both are very open with their data. Here is the download page for the trip data for Capital Bikeshare, where you can get detailed information about where each bicycle was rented from, and where it was returned to. Because the data is easily available many people have used the data to create their own analyses and visualizations. Some of the visualizations include an animation of riders leaving a sports stadium after a game or interactive exploration of trips between stations. Releasing the data has also resulted in useful statistics and crowdsourced suggestions for improvements. Boston embarked on a grander project, a data challenge contest that invited residents to create the best visualizations of the Bikeshare data. The Hubway Data Challenge garnered 67 entries from citizens. The contest resulted in some new insights for the people who manage the Bikeshare system, but it also gave the community a deeper understanding of how the Bikeshare system works and why it is valuable, creating a more informed electorate that will make beter future decisions. Part of the mission of the San Diego Regional Data Library is to link volunteers with city planning groups and social non profits to perform data analysis and create new visualizations, so we very interested in these sorts of events in other cities. Since the major way that nonprofits use data is to tell stories, visualization contests can generate a lot of new ways to organizations to explain what they do or help well they are doing it, both of which are critical components to getting funding and support from the community. Visualization contests are not a substitute for the deeper commitments that people make to town councils, planning groups or non profit social organizations, but they can be an important step in a pipeline that leads from people just living in a city to actively participating in its development.