
Next Tuesday the Data Library will be hosting a presentation on how to get started with analyzing crime data.


This will be a hands-on presentation, with demonstrations using multiple tools, including:
If you want to follow along, click on the links above and QGIS and Tableau. For Google Colaboratory, you can also use Jupyter Notebook, which is usually best to run via Anaconda.
Here are links to the data package we will be using, along with the names of the individual datasets:
- incidents: San Diego Region Crime Incidents 2007 – 2013
- i5y_sample: San Diego Region Crime Incidents 2007 – 2013
- sdcrime_16_20: San Diego Crime Incidents with Demographic Descriptions
- ca_abc_licenses: California and San Diego Alcohol Licenses
- sd_abc_density: California and San Diego Alcohol Licenses
- tracts: San Diego Demographics By Tract
- age_sex: San Diego Demographics By Tract
- total_population San Diego Demographics By Tract
- raceeth: San Diego Demographics By Tract
- pd_beats: San Diego Police Regions and Demographics
- pd_divisions: San Diego Police Regions and Demographics
- pd_neighborhoods: San Diego Police Regions and Demographics
- beat_demographics: San Diego Police Regions and Demographics
- sdpd_calls_dispositions: San Diego Police Calls for Service
- sdpd_beats: San Diego Police Calls for Service
- sdpd_call_type: San Diego Police Calls for Service
- sdpd_calls_for_service: San Diego Police Calls for Service
- ct_map: San Diego Police Calls for Service
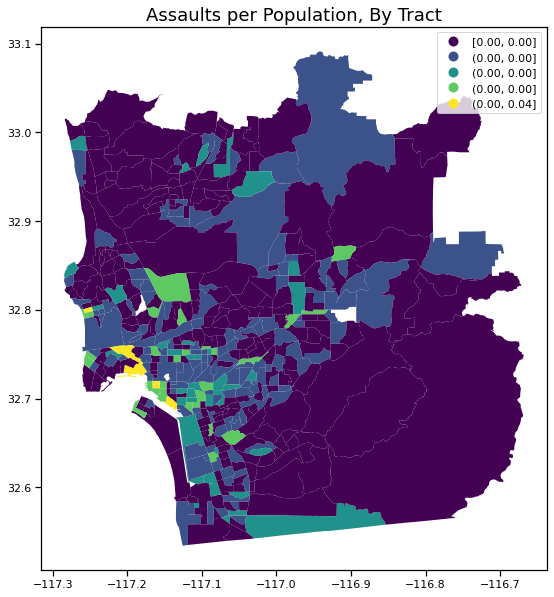
If you would like to get a preview, here are there Google Colab notebooks you can run to generate some basic maps, including this map of per-capital assaults, by census tract
- Descriptive statistics, from Wei Zhang
- Rhythm Maps
- Geography of Crime
Some other datasets collections you might find interesting:
- Police Data Accessibility Project
- Police Data Initiative
- Open Oversight
- Fatal Encounters
- Mapping Police Violence
See you next Tuesday!
1 thought on “Getting Started with Crime Analysis”
Comments are closed.